It’s now Spring in the Northern Hemisphere, Meteorological Spring to be more exact. March, April and May comprise the time period for Meteorological Spring. March 20 (Vernal or Spring Equinox) through June 21 (Summer Solstice) is the time period for Astronomical Spring, which is determined by Earth’s tilt and rotation around the Sun. Meteorological Spring is based on the seasonal transition between Winter and Summer weather conditions. With the arrival of Spring comes a significant increase in severe weather. Severe storms and tornadoes can occur throughout the year, but the climatological peak occurs during late Spring and early Summer.
Sunlight increases with each passing day, earlier dawns and later sunsets. Warmer days are more pleasant, and moist air from the Gulf of Mexico is transported north. This moisture is potential energy stored in water vapor, fuel for thunderstorms. The active roaring upper level jet stream of winter taps this moisture to produce significant severe weather events; high winds, large hail, flash floods and tornadoes. This is a very general and basic explanation of the spring severe weather season. Individual severe weather events are much more complex. So with the more pleasant days, please stay weather aware.
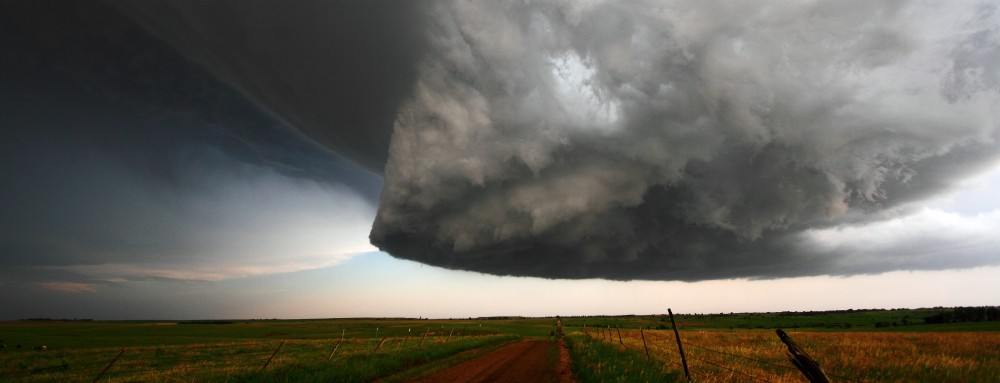
Very powerful supercell thunderstorm updraft, which produced 5.25 diameter hailstones, explodes over Oregon, MO 7th June 2009 – Brewer/Drake
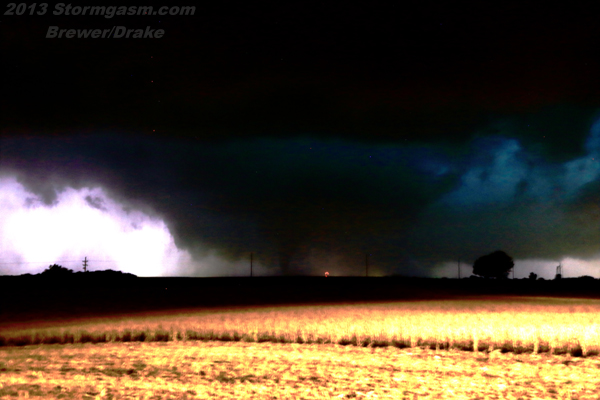
Non-identical twin tornadoes, from separate mesos, pass over Oklahoma wheat fields narrowly missing a farmstead near the town of Cherokee on 14 April 2012. – Brewer/Drake
Meteorologist Juston Drake’s arms are full of 4 and 5+ inch diameter hail collected in Oregon, MO on 7 June 2009. – Brewer/Drake
Large tornado 24 May 2016 south of Dodge City, KS by Juston Drake & Simon Brewer
The Madden-Julian Oscillation (MJO) has been accepted by many meteorologists and long-range forecasters as an atmospheric teleconnection with a significant impact on global atmospheric patterns. A relatively strong and progressive MJO wave can temporarily change a large-scale seasonal atmospheric pattern over a region the size of a continent. Sometimes a regional blocking pattern can be broken into a progressive pattern by an MJO wave.
I first took notice of the importance of MJO waves during the Summer and Fall of 2005. The very active 2005 Atlantic Hurricane Season was significantly affected by strong progressive MJO waves. Since then I’ve kept an eye on MJO Indices during the Hurricane Season. A few years later, I also began to see the importance of how MJO waves affect winter and severe weather patterns over the United States.
A rapidly dying strong El Nino mostly dominated the pattern over western North America this Spring. My good friend, a professional long-range forecaster and meteorologist Jim Bishop, felt this pattern was conducive for a large ridge over the Western U.S. and troughing over the Northeast throughout the Spring. He suggested the biggest reason for temporary breaks in this pattern was possibly caused by MJO waves. After pretty much hanging up my gear for the Spring-early Summer severe weather season I took a look at the data to see if there were any correlations between the MJO and patterns conducive for USA tornadoes.
My research was simple: I looked at the reported USA tornado graph from the Storm Prediction Center (SPC). I located dramatic increases in the 2016 tornado count I refer to as “tornado surges”. I, also, located MJO Waves during the year 2016 on the 15-day Mean MJO Index from the Climate Prediction Center (CPC). I created rough plots of the tornado surges on the MJO Index chart with MJO waves circled (SEE ATTACHED IMAGE BELOW).
2016 MJO Index via CPC & USA Tornado Chart via SPC
What I found was very interesting. I expected to see a moderate correlation in the data, but instead, found a relatively strong one. I subjectively determined there to be 6 tornado surges from January to mid-July of 2016. I determined there to be 5 progressive MJO waves during that period, excluding a strong MJO wave in late December into early January. It appears the 5 MJO waves matchup with 5 of the 6 tornado surges during the Spring and Summer of 2016. This suggests there was a reasonably strong correlation between MJO Waves and the atmospheric pattern conducive for surges in the number of USA tornadoes during the Spring and Summer of 2016.
It’s important to note I only looked at the time period between January and mid-July of 2016. I haven’t looked at any other years where other teleconnections may play a much different role in the large-scale atmospheric pattern over the USA. Also, this doesn’t suggest in any way that MJO waves create or cause patterns favorable for USA tornadoes. There are several big and many small atmospheric signals that affect global atmospheric patterns.
Map showing 8 tornado damage paths passing over Moore, OK from 1998 to 2015 (25 March 2015 path is preliminary)
Yesterday evening, 25 March 2015, one or more tornadoes caused damage in Moore, OK as a large supercell thunderstorm passed over the city. If only one tornado hit Moore last evening then 23 have been reported in the City of Moore since 1893. Of those tornadoes 8 have occurred since 4 October 1998 including 4 violent tornadoes (EF5, F5, EF4, and F4). The National Weather Service Office in Norman, OK is still conducting damage surveys, so all information regarding 25 March 2015 is preliminary.
***UPDATE: 1 April 2015 (not an April Fools joke) NWFO in Norman, OK has rated some of the damage as EF2 from the 25 March 2015 Moore tornado. Intermittent damage was found along the tornado path, which can be common with a weak multivortex tornado. I’ve posted a new tornado NWS damage path map image near the end of this article.
The City of Moore, OK has an area of 22.2 square miles. At least 8 tornadoes have passed over that flat piece of land in a period of less than 17 years. Several tornadoes have narrowly missed Moore in the last 17 years, so it’s not like the city is a tornado magnet. But still, 8 tornadoes over such a short length of time including 4 violent tornadoes is significant. Two of those tornadoes, 3 May 1999 and 20 May 2013, are considered by several meteorologist to be among the most intense recorded! If the preliminary tornado path from last evening is accurate it would cross 6 of the previous damage paths.
Below is a map overlaid with damage paths from the past 8 Moore tornadoes (2015 path is preliminary):
1998-2015 Tornado Damage Paths over Moore, OK (25 March 2015 Damage Path is Preliminary)
The recent Moore tornado streak began after dark on October 4, 1998. A large Fall Oklahoma tornado outbreak produced a relatively weak tornado over Moore. It was not the strongest tornado of the outbreak, but it received a large amount of attention after hitting a heavily populated area. The following year a devastating long track F5 tornado tracked 38 miles and passed through the heart of Moore. 4 years later an F4 tornado passed over a few of the same neighborhoods as the previous F5. A 7 year period of calm followed before a large supercell produced 3 tornadoes over the city in one day; an EF4 and two EF1 tornadoes. Only 3 years had passed when an EF5 wedge tornado caused horrific damage across the core of Moore. This tornado caused the most widespread damage of all the tornadoes to hit the city. The tornado, or tornadoes, last evening were much weaker and probably comparable to the 1998 October tornado.
4 October 1998 Radar Image showing hook echo over Moore OK as F2 Tornado was ongoing
October 4, 1998: F2
Path: 3 miles, 550 yards width, 7 minutes
Deaths/Injuries: none
Storm Development:
Supercell developed in Southwest Oklahoma off the dryline.
Outbreak: 26 tornadoes in Oklahoma
3 May 1999 Radar Images while F5 tornado was impacting Moore, OK
May 3, 1999: F5
Path: 38 miles, 1760 yards max width, 1hr 25 mins
Deaths/Injuries: 36 killed, 295 injured
Storm Development:
Supercell developed over Southwest Oklahoma off a pre-dryline convergence boundary in the warm sector: possibly a horizontal convective roll or gravity wave.
This tornado is considered to be one of the most intense tornadoes in U.S. History. Tornado reached peak intensity near Bridge Creek, OK.
Mobile Doppler Radar measurement of approximately 301 mph winds
Outbreak: 63 tornadoes in Oklahoma (Largest Outbreak in Oklahoma History), 74 total tornadoes including Kansas
8 May 2003 Radar Image showing debris ball after F4 tornado exited Moore, OK
May 8, 2003: F4
Path Length: 17 miles, 700 yards max width, 28 minutes
Deaths/Injuries: 0 killed, 45 injuries
Storm Development:
Supercell developed off dryline boundary west of I-35 Southwest of Moore, OK
Outbreak: 5 tornadoes in Oklahoma (43 total tornadoes documented)
This was the southern most tornado in the outbreak. This tornado reached peak intensity over Eastern Oklahoma City as it passed over the GM Plant.
8 May 2003 Violent Tornado leaving Moore, OK
10 May 2010 Radar Image with debris ball in white circle where EF4 tornado has just left Moore, OK
May 10, 2010: 3 tornadoes (EF4, EF1, and EF1)
Path Length:
EF4: 24 miles, max width of 2000 yards, 31 minutes
EF1: 4 miles, max width 250 yards, 5 minutes
EF1: 0.5 miles, max width 50 yards, 1 minute
Deaths/Injuries: killed 2, Injured 49 all from EF4 tornado
Storm Development:
Storm developed off dryline boundary West of I-35 West of Moore.
3 tornadoes moved over parts of the Moore City Limits.
Outbreak: 2nd Largest Oklahoma Tornado Outbreak (56 tornadoes in Oklahoma) behind May 3, 1999
20 May 2013 Radar Image shows large debris ball as EF5 Tornado is impacting Moore, OK
May 20, 2013: EF5
Path: 14 miles, 1900 yards max width, 39 minutes
Deaths/Injuries: 24 killed, 212 injured
Storm Development:
Supercell developed near Chickasha, OK off dryline boundary and appeared to have interacted with an outflow boundary near Moore.
Outbreak: 15 Tornadoes in Oklahoma (40 total tornadoes documented from event)
This tornado reached peak intensity near Briarwood Elementary School on 149th St and S. Hudson Ave. This tornado is considered one of the most intense tornadoes in U.S. History.
20 May 2013 EF5 wedge tornado hidden under ominous mesocyclone, debris, & rain in Moore, OK
20 May 2013 Violent EF5 Moore, OK Tornado shrouded in debris
22 May 2013 pile of debris in area of EF5 damage path in Moore, OK
6:42 PM CDT 25 March 2015 Radar Image: one or more tornadoes were impacting Moore, OK at this time (white circle around hook echo)
25 March 2015 Moore, OK EF2 Tornado Damage Path Map from NWS Norman, OK
March 25, 2015:
Rating: Preliminary EF1 (might be more than one tornado)***UPDATE: NWS Norman, OK Rated a single intermittent damage path with EF2 damage found
Path: estimated 6 miles, but might be more than one tornado ***UPDATE: single 8-12 mile intermittent damage path with Max width of 0.6 miles
Outbreak: ???
Deaths/Injuries: ???
Storm Development:
supercell developed West of Oklahoma City off cold front boundary.
“The Superstorm of ’93”, also referred to as “The Storm of the Century”, is regarded as one of the most powerful mid-latitude cyclones in recorded history to affect the East Coast of North America. On March 12-14, 1993 a high amplitude trough caused extreme bombogenesis to occur along the Gulf Coast. The deepening surface low pressure center intensified on a northeastward path up the U.S. East Coast causing damaging high winds, heavy snow, storm surge, and tornadoes. NCDC attributed 208 deaths to this storm in the United States.
13 March 1993 18z Infrared Satellite Image
In Tallahassee, FL a 976.5 mb pressure was recorded as the surface low passed. An intense squall line caused several tornadoes and 80-100+ MPH wind gusts over the Gulf Coast and Florida. The high winds from the deepening cyclone and squall line caused a 12 foot storm surge near Pine Island, FL. A 109 MPH wind gust was reported in Dry Tortugas, FL. NCDC reports 44 deaths are attributed to this storm just in the state of Florida.
12 March 1993 Storm Surge Map for Florida
6 inches of snow fell in parts of the Florida Panhandle. 17 inches of snow was reported in Birmingham, AL with 6 foot snow drifts! 56 inches of snow was reported on Mt. LeConte, TN and 43 inches in Syracuse, NY. The NWS Office in Ashville, NC reported a 4.2 to 1 snow/water ratio and NCDC reported 5.3 to 1 snow/water ratios nearby (normal snow/water ratio is 10 to 1). This was very heavy wet snow, which caused many roof collapses across the region.
12-14 March 1993 Snowfall Totals
High winds slammed the length of the East Coast and Appalachians. A 71 MPH wind gust was reported at LaGuardia Airport in NYC, and a 81 MPH wind gust was reported in Boston. Wind gusts of over 100 MPH were reported on many of the higher Appalachian summits. A record low pressure of 960mb was recorded in White Plains, NY. Surface pressure records were broken at many locations along the East Coast.
I still remember my Grandparents calling several days after the Superstorm had passed to tell us about their experience in Dandridge, TN. They were without power for days and had to trudge roughly 100 yards through hip-deep snow, high winds, and white-out conditions to my uncle’s house next door to stay warm and have food and fresh water. This was a very dangerous task for an elderly couple in a rural part of town in blizzard conditions. Nearly 3 feet of snow had fallen over their area with much higher drifts. 30 inches of snow was reported only 30 miles away in Gatlinburg, TN. They all huddled around a kerosene heater in my uncle’s living room as they waited out the storm. Only 300 miles north in Moraine, OH my house received only a few inches form this historic event.
6 Jan 2015 heavy lake effect snow with traffic in Watertown, NY
Happy New Year! It’s now 2015, hard to believe I’m starting my 16th year of chasing storms and extreme weather events (began chasing in Fall of 1999). I’ve spent most of the new year driving between Cleveland, OH and Watertown, NY documenting lake effect snow events. Only once have I chased a synoptic scale storm this winter and even that chase ended with lake effect snow in western New York. So far I’ll remember this winter for its lake effect. All of my late 2014 lake effect snow chases were from Lake Erie snow bands, including and event near Erie, PA and Cherry Creek, NY just before the New Year on December 30th. As of now, all of my 2015 chases have been focused on Lake Ontario snow bands.
7 Jan 2015 2:49 am KTYX base reflectivity showing intense lake effect snow band over Adams Center, NY
January 5-9th one of the most significant lake effect events of the winter, 2nd only to the Nov 17-19 Buffalo Event, hit the east shore of Lake Ontario in Upstate New York dropping over 4 feet of snow in some areas. I documented this storm in towns like Fulton, Adams Center, Watertown, and Parish, NY. At times this lake effect band was of equal intensity as the infamous November Buffalo band with 40-50 dBz reflectivity detected on radar. White out conditions and 3-5 inch per hour snowfall rates were common in this Lake Ontario snow band! January 5th 3 feet of snow accumulated in less than 24 hours in Fulton, NY, and over 4 feet of snow fell on Adams Center on January 6th thru 9th.
Update 9am 26 Jan 2015: I’ll be documenting a Nor’easter in New England from the 26-28 Jan 2015, so I’ll be adding another non-lake effect event to my list of Winter 2014-15 Chases.
Below are a few images from January 5-7, 2015 in region between Fulton to Watertown:
6 Jan 2015 Watertown, NY Lake Effect Snow
6 Jan 2015 snow-covered cars in Fulton, NY
5 Jan 2015 truck buried in 3ft of snow near Fulton, NY
5 Jan 2015 car stranded in 2+ feet of snow near Fulton, NY
6 Jan 2015 snow-covered van in Fulton, NY
6 Jan 2015 man clears drive with snow blower in Fulton, NY where 3 feet of snow fell in less than 24 hours
5 Jan 2015 snow collected on top of fire hydrant in Fulton, NY
5 Jan 2015 police assisting stranded motorist near Parish, NY in heavy lake effect snow band
5 Jan 2015 sun shines through edge of intnse lake effect snow bane south of Fulton, NY where 3ft of snow fell in less than 24 hours
Below are several photos taken during afternoon on 19 November 2014 in Lancaster, NY where 63 inches of snowfall was reported from historic lake effect snow storm from 17-19th:
Violent Wedge Tornado & Mesocyclone near Coleridge, NE June 17, 2014
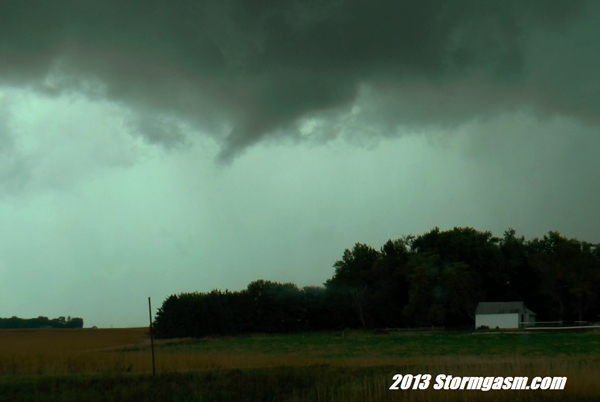
Violent Wedge Tornado & Wall Cloud near Coleridge, NE June 16, 2014
It’s a cliché statement on websites and blogs, but it’s been way too long since my last post. Above are 2 photographs taken on June 17, 2014 showing one of the most powerful tornadoes Juston Drake and I have ever witnessed near the town of Coleridge, NE. Juston and I performed a damage survey 3 days later and discovered a large region of severe ground scouring from this tornado north of Coleridge. This was one of many tornadoes from the most productive 3 days of storm chasing during the Spring of 2014. This Spring was slow to say the least for chasing storms. It’s inactivity was probably only eclipsed by the slow Spring of 2013. Several powerful tornadoes did occur despite the low numbers. Most severe setups during the Springs of 2013 and 2014 were weakened by a strong Capping inversion and/or dry air mixing into the boundary layer. It’s difficult for significant tornadoes to develop in the absence of deep boundary layer moisture. The presence of a strong CAP may have aided the few very intense tornadoes the past 2 years. Incredible instability developed aided by a strong CAP when deep moisture was present (i.e. 15-31 May 2013, 27 & 28 April 2014, and 16-18 June 2014). I’ll make an effort to write “2014 Spring Recap” and “Hurricane Arthur” posts soon.
It’s early May and 2014 has already rivaled 2013 in terms of below average number of tornadoes. Tornado outbreaks on April 27, 28, and 29 pushed the annual preliminary tornado count above 2013 up to the date of May 2nd. The large-scale pattern appears to be favorable for at least the next week or two for more severe weather events over the United States. The forecast for a pattern conducive for severe weather becomes much more difficult as May progresses. A significant ridge is likely to build and dominate the Western U.S. by late May and June. Once in place this pattern will be difficult to change, but can be temporarily broken by MJO waves, similar to June of 2009.
Juston Drake and I have been roaming the Plains and Southeast documenting storms and tornadoes. Most of the events we’ve chased lacked deep low-level moisture making the storms high-based, outflow dominant and generally weak in nature. The outbreaks of April 27 and 28 had deep Gulf of Mexico moisture available, which played a significant role in those deadly events. Below are a few images we’ve captured so far this year:
Dramatic supercell west of Eldorado, OK Apr 20, 2014
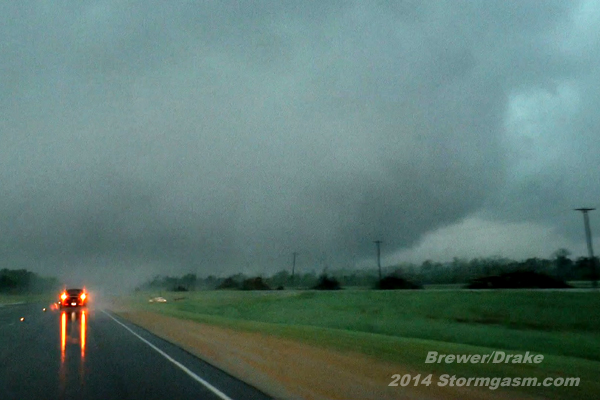
Tornado-warned supercell over Memphis, TN Feb 20, 2014
Juston Drake photographs mesocyclone structure southwest of Columbus, MS Apr 28, 2014
Mammatus from MCS anvil near Hearne, TX Mar 28, 2014
RFD gust front structure near Eldorado, OK Apr 20, 2014
Juston Drake films wall cloud before it produces Greenville, TX tornado Apr 3, 2014
Mesocyclone & wedge tornado approaching Louisville, MS Apr 28, 2014
Tornado-warned supercell near Holden, MO Mar 27, 2014
Occluded mesocyclone & wedge tornado south of Columbus, MS Apr 28, 2014
Wedge-shaped tornado south of Columbus, MS Apr 28, 2014
Juston Drake photographs supercell west of Eldorado, OK Apr 20, 2014
Anvil Crawler lightning over Altus, OK Apr 26, 2014
MCS shelf cloud southeast of Pine Bluff, AR Apr 24, 2014
High-based supercell thunderstorm north of Hollis, OK Apr 23, 2014
Tornadic Supercell with wall cloud west of Eldorado, OK Apr 20, 2014
Wall cloud near Princeton, TX Apr 3, 2014
Wall cloud shortly before producing wedge tornado southwest of Columbus, MS Apr 28, 2014
High-based supercell at sunset west of Wichita Falls, TX Apr 23, 2014
Late evening on October 3, 2013 Juston Drake and I documented a tornado near Panama, NE. The Omaha/Lincoln NWS Office later determined the tornado had a 16.5 mile long path with EF2 damage, and a maximum width of 300 yards. The tornado affected several farms, but fortunately missed several towns passing north of Panama, south of Bennet, and west of Palmyra.
Tornadic Supercell Northwest of Panama, NE on October 3, 2013
Multivortex Cone EF2 Tornado South of Bennet, NE October 3, 2013
The following day, October 4th, we chased a significant tornado outbreak affecting parts of Nebraska, South Dakota, and Iowa. Click on the video below to view a short clip from our chase showing the massive Wayne, NE EF4 tornado:
Our initial target was Northeast Nebraska and Northwest Iowa. A very intense trough/mid-level closed low was progressing over the Northern Plains. This trough would provide significant upper-level lift for the formation of vigorous updrafts, cold mid-level air for enhanced instability, and deep-layer shear for powerful supercell storms over the Central Great Plains.
4th October 2013 22Z 700mb Analysis
Deep tropical moisture over Kansas and Missouri, which helped fuel storms the previous night, was advecting northward into the area. At the surface a primary warm front was retreating over northern Nebraska and Iowa, a pseudo warm front/deep moisture boundary was retreating north of the I-80 corridor. A modified Pacific cold front/dryline boundary was progressing over the Eastern Plains with a noticeable bulge southwest of Omaha. Storms north of the bulge would be more likely to be isolated with a storm motion nearly perpendicular to the dryline boundary. Storms south of the bulge were more likely to be outflow dominant/elevated with a path nearly parallel to the boundary.
4 October 2013 2143Z Surface Map Analysis
A relatively warm layer of air near 800mb was overriding the warm sector from the Southwest providing a strong, but breakable capping inversion. This CAP held off widespread convection throughout most of the day over the warm sector. Also, a widespread upper-level clear slot moved over the Central Plains maximizing daytime surface heating. Instability dramatically increased over Northeast Nebraska and Northwest Iowa as the day progressed. Between 1000-3500 J/kg of surface-based CAPE was developing in the region–the actual amount of CAPE can only be estimated, because mid-level temperatures were cooling very rapidly from cold air advection and significant upper-level lift.
2215Z Watervapor Satellite Image Analysis from October 4, 2013
18Z Modified Omaha, NE Upper Air Sounding on October 4, 2013
The deep layer wind shear north of the dryline bulge was incredible and the low-level shear was nothing short of amazing. 0-1km, 0-3km, and effective layer storm-relative helicity values were between 200 and 600 m2/s2. The surface low was located near O’Neill, NE and not just one, but two warm front boundaries were in the area of interest–it shouldn’t be a surprise relatively high surface vorticity values were being analyzed. The combination of high shear and instability over northeastern Nebraska and northwestern Iowa was similar to any high end tornado environment. The effective layer EHI’s (Energy-Helicity Index) values ranged from 3 to possibly as high as 13 (most likely near 8 or 9) over the region when the event was unfolding.
22Z RAP Mesoanalysis on October 4, 2013: 0-1 EHI’s, Effective Layer Helicity, 0-3 CAPE & Surface Vorticity, & SFC-Based CAPE
Juston and I were northwest of Freemont, NE when storms began developing to our West and Southwest along the dryline. We decided to intercept a small cluster of developing updrafts near Columbus–they were moving into an environment conducive for strong tornadoes. Updrafts to the southeast were struggling, which kept the low-level flow going into our developing storm virtually untapped.
2045Z Visible Satellite Image on October 4, 2013– developing tornadic supercells can be seen over northeast Nebraska
We intercepted the now strengthening storm south of Stanton. We could see the updraft base was rather elongated. A second updraft base was to its south; soon we witnessed a long and slender rope landspout tornado develop under this southern base as we sat waiting for a pilot vehicle in construction south of Stanton (why does it seem construction crews are so active during major severe weather events?). The tornado dissipated and we continued north on sandy roads out of town as the two updrafts began the sloppy process of merging. About 12 miles southwest of Wayne the supercell quickly organized–developing inflow bands, a large base, and a huge RFD clear slot. Soon a large bowl funnel appeared to our WNW, and in less than a minute we could see condensation vorticies touching down under the massive funnel cloud. Only moments later the tornado took on a wedge appearance.
Large tornado developing southwest of Wayne, NE on October 4, 2013
The rotating debris cloud near the surface was nearly twice the size of the visible condensation of the wedge tornado indicating a much larger and more significant tornado vortex. The scene forced us to immediately recall relatively fresh memories from the developing stages of the massive 2.6 mile wide El Reno tornado earlier this year. The base was gargantuan, the debris cloud was huge, and what would typically be a large wedge-shaped condensation funnel in contact with the ground appeared small. We repositioned southeast of Wayne as the tornado rapidly grew giving it a little more room during its intensification process.
Large Multivortex tornado forming south of Wayne, NE on October 4, 2013. Notice larger debris cloud surrounding condensation vortex indicative of a much larger tornado
text-book supercell structure with massive EF4 wedge tornado near Wayne Nebraska on October 4, 2013
The tornado briefly became wrapped in rain and we were soon floored by the spectacle before us–a monstrous megawedge tornado dominating the western horizon. I can only compare what was unfolding before our very eyes to the 2004 Hallam, NE and 2013 El Reno, OK tornado events. I have to say I was very surprised at what was occurring; we felt the conditions were conducive for several long-track strong to violent tornadoes, but this was on an entirely different level.
Massive EF4 wedge tornado near Wayne, NE October 4, 2013
Monstrous EF4 wedge tornado approaching 2 miles wide near the town of Wayne, NE on October 4, 2013
2219-2231Z Base Reflectivity Images from Omaha showing Wayne, NE supercell when tornado was ongoing–notice large debris ball & vortex hole in the final image indicating a very large tornado
2219-2231Z Storm Relative Velocity Radar Images from Omaha showing strong rotation couplet with Wayne, NE supercell when tornado was ongoing
We followed the massive tornado as it tracked north-northeast at nearly 30 mph. Approximately 2 miles southwest of Wakefield we saw a cone funnel quickly develop along the RFD gust front. Debris lifted into the air as it passed over a field and we could see it was an anticyclonic tornado (anticyclonic tornadoes rotate clockwise in the Northern Hemisphere).
Dissipating funnel cloud from anticyclonic tornado SW of Wakefield, NE on October 4, 2013
After the anticyclonic tornado dissipated, a new wall cloud developed east of the now rain-wrapped Wayne tornado. We had been steadily losing ground on the storm, so we decided to make a significant reposition to the northeast in an attempt to beat the storm to the Sioux City, IA area. As we approached Sioux City another supercell to our South was rapidly intensifying and would soon cause problems for our storm. We immediately dropped our storm, even though it was still producing tornadoes, and punched east through the outer fringes of the new tornadic supercell. We positioned about 10 miles northeast of the updraft near the town of Quimby, IA. The amazing striated rotating updraft of the Pierson tornadic supercell was bearing down on us. There were reports of a large damaging tornado, but heavy rain under the meso made it impossible for us to see a tornado.
Image of incredible supercell structure from Pierson, IA tornadic supercell shot several miles W of Quimby looking SW
As the supercell quickly approached our location, we drove east of Quimby, letting it pass to our northeast. As night fell more storms began to develop to the south. We sat on the south side of Storm Lake, IA and watched the southern-most storm pass to our northwest. We tried, but failed, to see a possible tornado backlit by lightning as the storm passed. The Sioux Falls NWS Office later found a 5.45 mile long EF1 damage path with this storm northwest of Storm Lake near the town of Alta.
NWS Prelim Damage Survey Map with Juston and Simon’s chase path and notes from October 4, 2013
This outbreak was significant regardless of the time of year. There were 5 significant tornadoes: 3 were long-track, 2 of these caused EF4 damage and were unusually wide–both at or exceeding 1.5 miles at their maximum width. The Omaha/Lincoln NWS Office determined the Wayne, NE tornado had a 19 mile path length, a maximum path width of 1.38 miles (disputed), caused 15 injuries, and caused EF4 damage to an industrial complex on the east side of town. Fortunately, the tornado passed mostly east of town sparing a majority of the population, but it still severely affected many farms.
damaged pickup truck stranded in field southeast of Wayne, NE from a large EF4 tornado on October 4, 2013
The following morning, October 5th, Juston and I conducted a damage survey south and north of Wayne, NE. We found the maximum damage path width was between 1.8 to 2.2 miles in diameter near the town of Wayne (exact width is nearly impossible to determine from RFD and inflow damage). The tornado damage path was wide with smaller more intense areas of damage to crops and structures caused by multiple vorticy suction spots. Fall tornadoes are not uncommon, but a significant outbreak like the October 4, 2013 event with several very large and destructive long-track tornadoes is rare.
Damaged corn field near Wayne, NE from October 4, 2013 EF4 Tornado
This trough also produced a record setting blizzard over western South Dakota and Wyoming. 58 inches of snow was recorded in Beulah, SD, and a maximum wind gust of 71mph was measured at Ellsworth Air Force Base near Rapid City, SD. Many people lost power during the storm as high winds knocked down trees and utility poles already burdened with the weight of the heavy wet snow. The storm killed significant numbers of livestock as animals became lost and confused in the blowing snow. Some animals suffocated when they were covered by heavy wet snow drifts. In the early Spring and late Fall, blizzards and tornadoes can happen side by side with a powerful trough.
2014Z NWS Watch and Warning Map on October 4, 2013 during showing Tornado Watches along with Blizzard Warnings
Special thanks to Juston Drake for acquiring data used in this article, and to local fire department and law enforcement employees and volunteers around Wayne, NE for allowing us access to perform a damage survey following the disaster.
September 12, 2013 Water Vapor Image Loop Courtesy of Colorado Climate Center
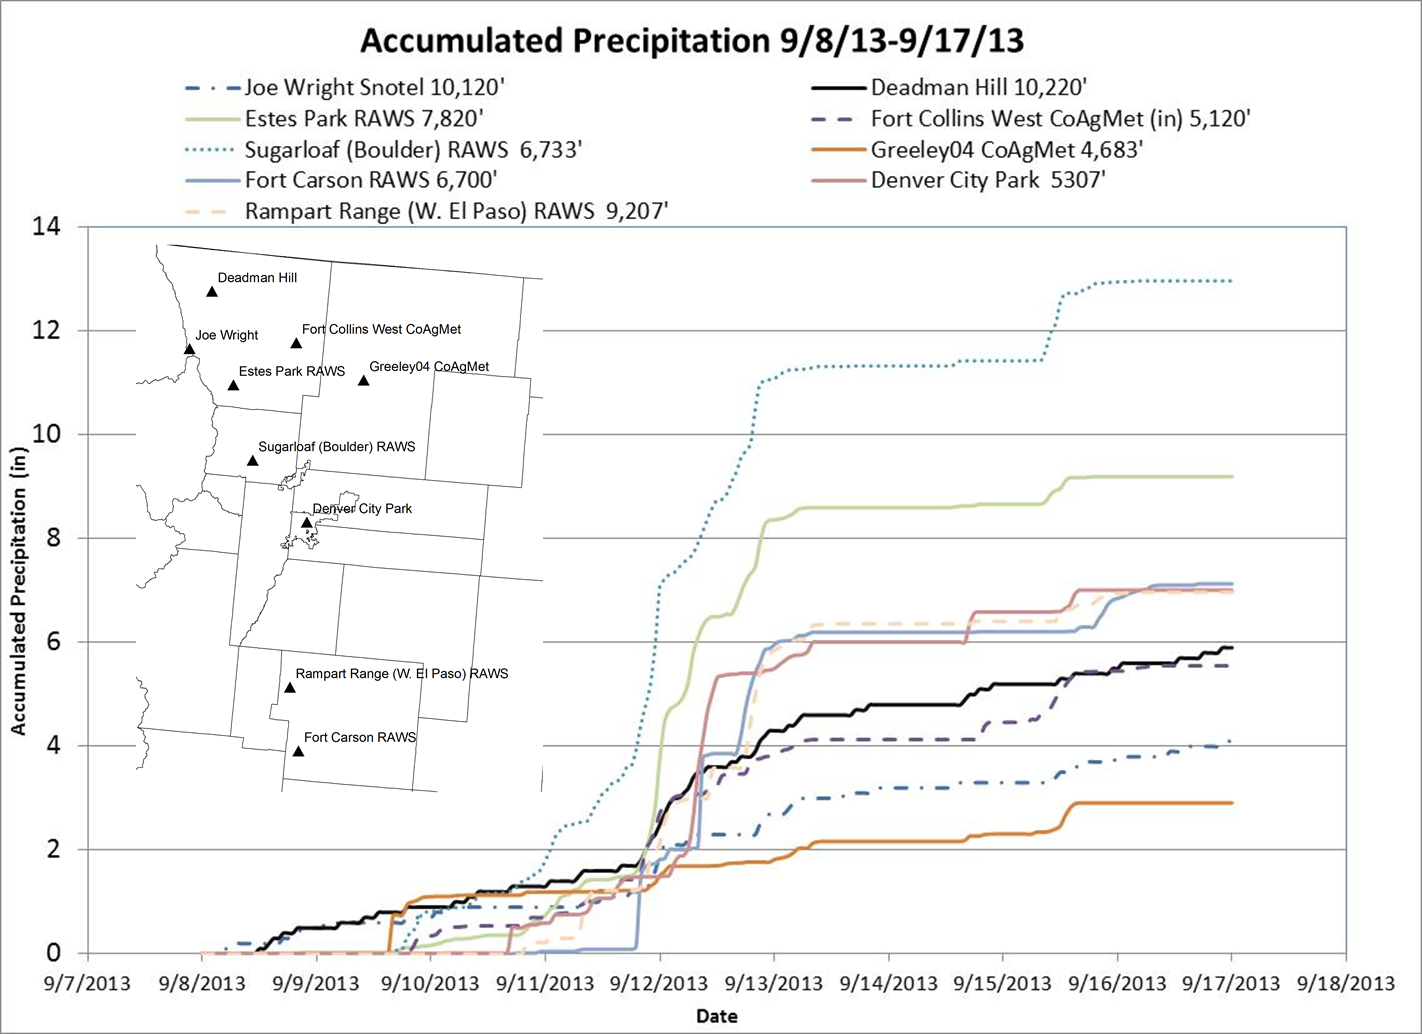
By Mid-September, most people living in the Mountain West were going to remember 2013 for a continued drought from 2012 and horrific wildfires. But those living along the Colorado Front Range might forget the dry heat and fires. Between September 8th and 10th, rain began falling in many areas over the steep terrain of the Colorado Rockies. But by the 11th, that rain became torrential. By the 15th, many locations had received half a year’s worth of rain; and in some areas the all-time daily and monthly records were shattered. Terrifying flash floods and landslides resulted from the record rainfall all over the Central Rockies. Homes, roads, bridges and lives were swept away, stranding thousands and cutting-off entire communities. Many places were accessible only by air or on foot; rescuers had to hike in or arrive by helicopter.
The primary player in this event (the heavy precipitation pattern) could be seen evolving at least a week in advance, if not further. A strong upper-level low over the American Southwest combined with a large ridge over the Eastern U.S. to pump one of the juiciest subtropical airmasses many Coloradans will ever experience. This airmass came up from the Caribbean and into the heart of Rocky Mountains, the virtual rooftop of the Contiguous 48 States. Upslope combined with a stalled cold front created perfect conditions for constant heavy showers and thunderstorms over the Western High Plains deep into the High Country of Colorado, Southern Wyoming, and Northern New Mexico. The pattern was steady and slow to evolve and easy to recognize.
Some locations, including the Front Range town of Boulder, were soaked by 10 to 20 inches of rain in only a few days. 9.08 inches of rain accumulation was measured in Boulder over a 24 hour period–smashing the old record of 4.80 inches. Boulder also broke its all-time monthly rainfall record (17.18 inches) by more than 7 inches and already set a record annual total of 30.14 inches.
Accumulated Precip Graph Sept 8-17, 2013 Courtesy of Colorado State University
Widespread rainfall totals between 5-20 inches over just several days in any region of the United States will cause terrible flooding, but this was over the Central Rockies of Colorado. The high and rugged mountainous terrain is cut by steep valleys and canyons; the water descends quickly, funnels into narrow passages, rises and moves with tremendous force. As if crazy heavy rainfall over very large mountains wasn’t enough, the prolific drought, which began in Spring of 2012, combined with multiple large and destructive wildfires left many slopes barren, wiping out acres of vegetation. This dramatically increased the threat of mud and rock slides by creating a faster, easier path for water to run off into swollen streams and rivers. The record rainfall over the relatively dry, fire-scarred, and mountainous terrain of Central Colorado was a recipe for disaster. The result was horrific flooding and landslides in the valleys and canyons of the Central Rockies.
Meteorologically speaking, it’s quite common to have this type of cause and effect scenario. The record-breaking drought and wildfires paved the way for potential landslides caused by record rainfall totals.
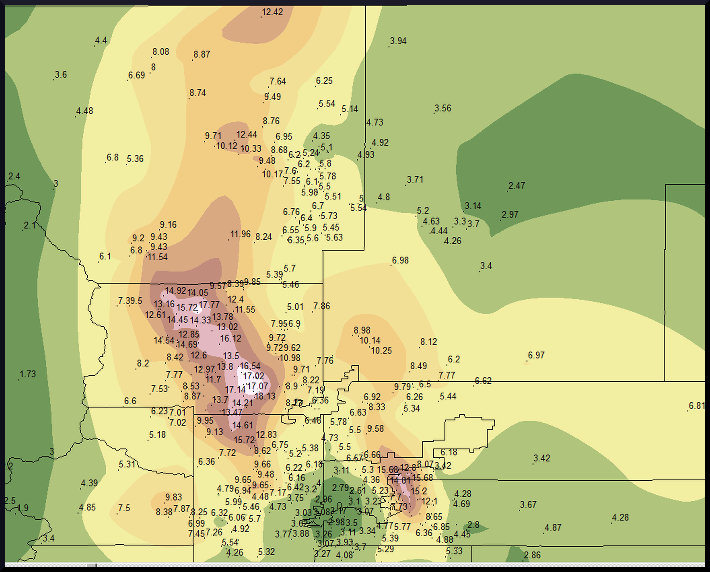
Storm Precip Totals Courtesy of NWS Boulder
The Hydrometeorological Design Studies Center (HDSC) has determined areas like Boulder, CO were affected by a 1 in 1000 year event due to the extreme amount of rainfall, which occurred in a 24 hour period. The findings from the HDSC puts the magnitude of this rainfall/landslide/flooding event into perspective: it was megalithic! The Denver/Boulder National Weather Service Office created a webpage discussing Central Colorado flooding in September of 1938 comparable to the September 2013 event: http://www.crh.noaa.gov/images/bou/precip/Presentation2.pdf
This flood was huge: 1 in 1000 year odds for some areas like Boulder, but, despite being so incredibly rare, is there anything to learn from this devastating event? I believe so. Nearly every location on this planet is under threat of excessive precipitation and resulting floods. No place is exempt from flooding when almost 20 inches of rain falls over a period of several days. It’s a terrible tragedy for many affected in Colorado, Wyoming, and New Mexico. Hopefully, they won’t experience another event like this in their lifetimes. Some people may even think twice about living in an area susceptible to 100 year floods, or maybe even 1000 year floods. The people who live in the narrow valleys and canyons in the foothills and mountains have to make a choice… Some will rebuild, but others may not. The beautiful steep-walled canyons of the Colorado Front Range should be a constant reminder of the floods which dug out such amazing geological gashes in the uplifted rock. Valleys are created very slowly over long periods of time, but canyons are literally gouged from the Earth in a violent fashion. These chasms can be extremely dangerous during a flood because of the steep walls. They’re nearly impossible to climb and offer no help when going up is the only way out.
The Big Thompson River passing through Big Thompson Canyon was badly affected from this event…and reminiscent of the tragedy that struck there on July 31, 1976. Big Thompson Canyon is very narrow with steep rock walls in many places. Route 34 weaves through this deep gully and often there’s only enough room for the road and river. During storms, water falls on the surrounding hills and mountains, then descends rapidly down steep rocky slopes into the washes and streams feeding the Big Thompson River, and with nowhere else to go the flow becomes a raging flood in the narrow canyon carrying boulders, cars and anything else in its path.
The 1976 Big Thompson Canyon Flood is now an infamous case study taught in many meteorologist classes in universities around the country.
Driving through this Canyon in July 2013, I couldn’t help but feel slightly uneasy and a little in awe passing between the shear rock walls along a healthly flowing Big Thompson River–knowing this was the site where more than 140 people were killed in the 1976 flood. It kind of surprised me to see numerous buildings perched on slivers of dry ground wedged between the river’s edge and rock walls on my way to Loveland from Estes Park. I’ve seen way too many people rebuild on a flood plain, or on a beach without proper stilts to protect from the wrath of a hurricane’s storm surge, or in the heart of Tornado Alley without a safe room or storm shelter. Can’t really say, “don’t build there”, because no place on this planet is safe from disaster. We can only hope people will remember, learn, and take proper precautions in disaster-prone areas to protect themselves and their loved ones.